
SAT Math is divided intro three domains:
- Heart of Algebra
- Problem Solving and Data Analysis
- Passport to Advanced Math
It's a good idea to get really familiar with what's going to be on the test, where it was derived, and what the SAT is really testing.
This post will focus on one domain—Problem Solving and Data Analysis. This is an opportunity to get cozy with these concepts, and with the overall tapes of information that test-makers are looking for. Problem Solving and Data Analysis problems are all about applying your math knowledge to practical situations and looking at actual statistics instead of abstract, theoretical scenarios.
Basic Information
There are 17 questions in this domain (out of 58 total math questions). They aren't labeled or otherwise indicated on the test—you're never told which type of question you're working on.
There are no Problem Solving and Data Analysis problems on the no-calculator section. You will always be permitted to use your approved calculator for questions from this domain—though you may not always need it.
You will receive a subscore on a scale of 1-15 on this domain.
There will be both multiple choice and grid-in questions.
You'll be dealing with both single-step and multistep problems; sometimes, it's just a matter of reading the data and parroting it back, while other problems require a bit more manipulation of the numbers.
General Concepts
The test-makers want to know that you understand math thoroughly enough to use your skills in real-world settings.
Quantitative reasoning is also crucial; you should be able to work with numbers and draw conclusions about what they imply.

You’ll be working with a lot of numbers.
Real-World Applications
You should be able to build a representation of a problem. If a scenario is described to you, you should be able to model it mathematically by describing it with expressions and equations.
You should know to consider the units involved. If there happens to be a shift of units (from feet to miles, or something like that), you should account for that as you calculate.
You should keep track of the practical meaning of quantities. You're going to be representing real values with variables: don't forget what those variables represent. Also, be sure you understand how a change in one of these variables or quantities affects what's happening in the equation. For example, in a line ($y=mx+b$) with a positive slope (or value of $m$), increasing $x$ will also result in an increase in $y$.
Data and Statistics
There are a lot of graphs, charts, and tables that could be covered on the test. You should be capable of analyzing one-variable data in bar graphs, histograms, line graphs, and box-and-whisker plots—as well as two-variable data in scatterplots and two-way tables. In other words, you should be fluent in reading these various representations of data.
You should be able to describe overall patterns. You'll have to identify positive and negative trends. You should be able to distinguish between linear and exponential growth.
Specific Skills
There are a number of skills that you'll want to be handy with on the day of the exam. In this section you'll find a discussion of these skills, including what they are and what they look like in action.

In fact, let’s hope these skills aren’t all that new!
Statistical Analysis
The measures of center are arithmetic mean (average) and median. If they can't be calculated from what's given, you may still need to draw some conclusions about them. Even if you can't find the actual number, there may be a question about what possible values are, or how the values compare to another set of data. Outliers typically affect the mean, but not the median.
The measure of spread to know is standard deviation. You've got to have the basic theory, but you won't need to calculate the exact value. You should be able to look at two sets of data and see which set is more spread out—that is, which has the greater standard deviation.
Insofar as the precision of estimates is concerned, everything depends on the variability of the data and the sample size; smaller variability combined with a larger sample size makes for estimates that are more precise in terms of the actual population.
Another tidbit of interest you should know is that randomization combats bias.
You should, in context, be able to work with margins of error, which are affected by sample size and standard deviation.
Confidence intervals should also be taken into account. The SAT always works with confidence intervals of 95%. This doesn’t mean that 95% of the population is necessarily described by the figure that’s been derived, just that we can be 95% certain that the descriptive figure that’s been reached is accurate.
When analyzing the relationship between two variables, remember, correlation is not causation. If subjects for a sample are selected randomly, we can generalize to the entire population reasonably well. If subjects are randomly assigned to test groups, we can reasonably speculate about cause and effect. Otherwise, though, we’re out of luck.
You should also be able to evaluate reports to make inferences, justify conclusions, and determine the appropriateness of data collection methods.
Take a look at this problem:
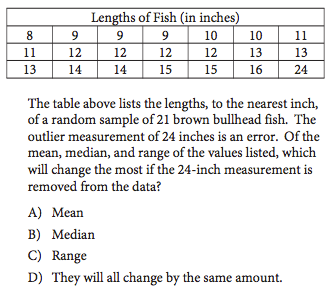
The correct answer here is (C). We know that removing one very high number from the set is not going to affect the median—the middle three values are all 12, so we know the median will still be 12, even if the middle of the data is shifted over one. The mean will shift somewhat if we don’t include the 24-inch measurement, but there are 20 other data points that anchor the mean at a relatively consistent value if any one value is removed. The range, however, will change from $24-8=16$ to $16-8=8$. The range gets cut in half if we remove the 24-inch measurement! That’s the measure that will change the most.
Mathematical Models
The domain of the SAT that we’re examining gives special attention to mathematical models. You must, therefore, be able to create and use a model.
When two variables are presented in a graph, table, or other chart, you should be handy with analyzing and drawing conclusions with regards to the relationship between these variables.
Relationships between variables can be modeled by functions, but remember the function is only a model! It may give scientifically accurate predictions, or it may just describe a general trend. You may be asked whether a model is good, acceptable, or entirely inappropriate.
Let’s look at this problem:
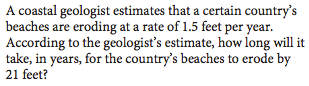
The geologist in the question provides a model regarding the country’s beach erosion. According to that model, beaches erode at a rate of 1.5 feet per year. 21 feet of erosion would therefore take 14 years, as $14(1.5)=21$.
The functions you’re asked to work with may be linear, quadratic, and/or exponential. Linear and exponential are discussed in more detail below.
Linear
An important example of linear growth is simple interest, where you earn interest on your principal, each period, but not on any interest that has been added since that first deposit. This is modeled by the function: $A = P(1+rt)$. $P$ is the principal, $r$ is the interest rate, and $t$ is the amount of time interest has been accruing.
Exponential
An important example of exponential growth is compound interest, where you earn interest on the interest you’ve previously earned. This is modeled by the function: $A = P (1+r/n)^{nt}$, where $P$ is the principal, $r$ is the interest rate (typically annual), $n$ is the number of times the interest compounds per period (typically a year), and $t$ is the amount of time that has passed since the principal began accruing interest.
Be careful! The stated rate of change may not be the same as the rate of change over time. This is typical of compound interest:
- You might take a loan at 9%, but if it compounds monthly, you’re really taking a loan at $(1+.09/12)^12 – 1 = 9.38%$ at the end of the year.
- On the other hand, you might make a deposit that accrues interest at a rate of 5%, but it compounds quarterly, so you’re really getting $(1+.05/4)^4 – 1 = 5.095%$ at the end of the year.

Math and money are very closely linked.
Ratios, Proportions, Units, and Percentages
You’ll need to be familiar with direct proportionality/variation: $y = kx$, where $k$ is a unitless constant of proportion. This relationship may also be expressed as $x_1/y_1 = x_2/y_2$.
You’ll need to know how percent increase and percent decrease work. Be careful about how you approach these problems; they can get a little tricky. Remember, for instance, that if you have a 20%-off coupon for an item that’s on a 20%-off sale, you won’t save 40%. You’ll save 36%, as you’ll pay 80% of 80% of the original price: $x(.8)(.8) = (.64)x = x - (.36)x$.
Take a look at this pair of problems:
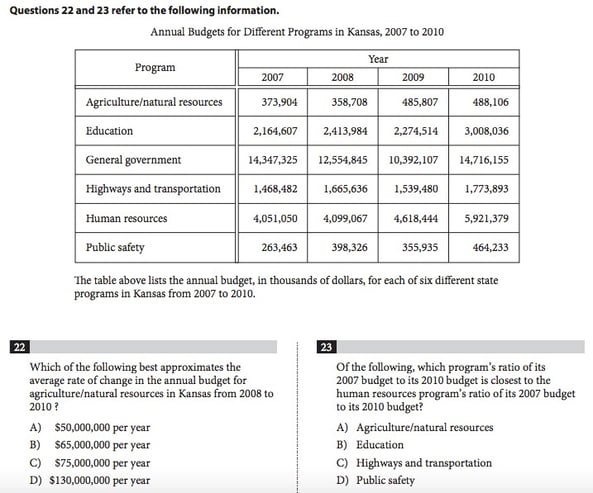
This is the sort of situation where you’re asked to deal with quantities in very practical terms. These aren’t just numbers floating in and out of an abstract function; no, these numbers represent that annual budget, in thousands of dollars, for each of six different state programs in Kansas from 2007 to 2010.
The first problem is asking for the approximate average rate of change in the annual budget for agriculture/natural resources in Kansas from 2008 to 2010. From 2008 to 2009, the budget grew by 127,099 thousands of dollars, or $127,099,000. From 2009 to 2010, the budget grew by 2,299 thousands of dollars, or $2,299,000. Thus, we add those two figures together, divide by two, and find that the average growth was $64,699,000, or, when rounding, (B).
For the next problem, we are comparing the 2007-budget-to-2010-budget ratios across the various programs. We will first need to find those ratios:
Agriculture/natural resources — $373,904/488,106=.766$
Education — $2,164,607/3,008,036=.7196$
Highways and transportation — $1,468,482/1,773,893=.8278$
Public safety — $263,463/464,233=.5675$
Out of these, the closest to human resources ($4,051,050/5,921,379=.6841$), is (B).
Probability
Two events are independent if one happening has nothing to do with another, like the sun shining and you eating a sandwich for lunch. The sun may shine, and you may eat a sandwich for lunch, but one does not cause or prevent the other.
Two events are mutually exclusive if they cannot both occur, like me wearing a hat and me not wearing a hat. I can’t do both.
For independent, non-mutually exclusive events: P(A and B) = P(A)*P(B), whereas P(A or B) = P(A) + P(B) - P(A and B).
For mutually exclusive events: P(A or B) = P(A) + P(B).
There are other formulas for more complicated scenarios, but these will get you pretty far — they’re all you should need on the SAT.
Let’s take a look at this problem:
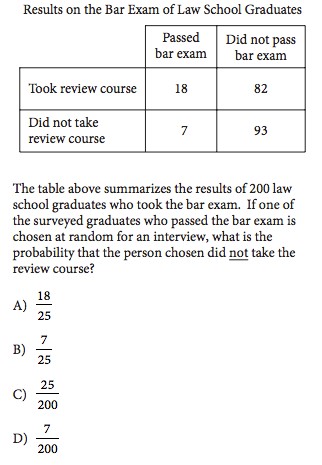
Twenty-five people passed the bar exam; of these, seven did not take the review course. So, the probability that the interviewed person in question did not take the bar exam is 7/25, or (B).

Math and gambling are closely linked, too. It’s all about that probability.
Conclusion
This domain of the test is calculation-heavy, although there are some theoretical questions.
These questions compose almost a third of the test. They cover, roughly:
- Statistical analysis
- Proportions
- Probability
- Modeling
- Real-world data
Your answers will be scored to yield one of three subscores for the Math section.
What’s Next?
That was a fair amount of information. Digest it a little; then, a great next stop would be perusing our overall guide to SAT Math, including directions to a number of other great posts.
Now, because Problem Solving and Data Analysis problems are so information-heavy, you may wish to practice with some word problems, to get used to that much verbal data being thrown your way.
As you’re trying these practice problems, you’ll want to know how to use them to your best advantage.
Want to improve your SAT score by 160 points?
Check out our best-in-class online SAT prep program. We guarantee your money back if you don't improve your SAT score by 160 points or more.
Our program is entirely online, and it customizes what you study to your strengths and weaknesses. If you liked this Math strategy guide, you'll love our program. Along with more detailed lessons, you'll get thousands of practice problems organized by individual skills so you learn most effectively. We'll also give you a step-by-step program to follow so you'll never be confused about what to study next.
Check out our 5-day free trial:

Have friends who also need help with test prep? Share this article!

Vero is a firsthand expert at standardized testing and the college application process. Though neither parent had graduated high school, and test prep was out of the question, she scored in the 99th percentile on both the SAT and ACT, taking each test only once. She attended Dartmouth, graduating as salutatorian of 2013. She later worked as a professional tutor. She has a great passion for the arts, especially theater.


 Holly R.