Another year, another chance to take the SAT! If you're taking the SAT this year, you might be wondering: just what is a good SAT score for 2018? Is there a particular score I should be aiming for to make sure I get into the colleges I want to go to?
To answer the question of what good SAT scores for 2018 are, this article looks at a few different definitions of what makes a good SAT score, and how this has changed over time. We also explain why SAT score goals should be specific to each student and give you step-by-step instructions for choosing your target SAT score.
What Is a Good SAT Score for 2018 Overall?
On an individual level, a good SAT score is any score that gets you into at least one of the schools you want to go to. To figure out what a good 2018 SAT score is for all students, however, we'll need to take a broader view of SAT score data. The best way to do this is to take a look at the most recent data for the average SAT score and SAT score percentiles and see how your scores and percentiles compare.
As a general rule, good SAT scores are ones that place you in the top half of test-takers; the farther above average your score is, the better. Similarly, a not-so-good SAT score is one that lands you in the bottom half of test-takers (and the further below average your score is, the worse).
The latest College Board data indicates that the average SAT score for graduating seniors was 1060 (533 Evidence-Based Reading and Writing (EBRW), 527 Math), which means that good SAT scores for 2018 are those above the average SAT score of 1060/1600.
To take a closer look at the different levels of performance on the SAT, we've created a chart with SAT percentiles and scores using data from students who took the new SAT and graduated in 2017. Remember that a percentile score tells you what proportion of students performed at or below your level (e.g., a 50th percentile score means 50% of students performed as well as or worse than you).
| Percentile | EBRW | Math | TOTAL |
|
90th percentile (excellent) |
670* |
680* |
1340* |
|
73rd percentile (good) |
600 |
590 |
1180 |
|
50th percentile (average) |
530** |
520** |
1050** |
|
25th percentile (poor) |
460 |
450 |
910* |
|
10th percentile (very poor) |
400 |
390 |
810* |
Source: SAT Understanding Scores 2017
*Score is one percentile higher than percentile listed (e.g. 91st or 24th percentiles).
**Score is one percentile lower than percentile listed (e.g. 49th percentile).
(Note that the percentiles of the total scores aren't always equal to the percentiles of the sum of the section scores. This is most likely due to score rounding, since scores are reported in increments of 10; for instance, the real 91st percentile EBRW and Math scores might be 665 and 675 respectively, which sum up to a total 91st percentile score of 1340, but round up to 670 and 680.)
One (potentially surprising) number jumps right off the top of the chart—your SAT score doesn't need to break 1500, or even 1400, to put you in the top 10% of students. As the chart above indicates, a score of 1340 is in the 91st percentile! Thus, any score at or above 1340 is extremely impressive.
On the lower end, any total score between 400 and 810 (a pretty wide range) puts you in the bottom 10 percent of test takers. If you raise your score to a 910, you'll still be performing worse than 75 percent of test takers. Because of this, it's pretty safe to say that any score at or below 910 is a bad SAT score.

As we said earlier in this article, comparing your performance on the SAT to all other students who took the SAT is a fairly general way to look at things. After all, the main reason you want to perform well on the SAT is not just to have bragging rights that you got a high score, but to get into college.
Depending on what colleges you apply to, a 91st percentile score could be way more than you need—or it could be lower than the score of the lowest-scoring accepted student. So how do you figure out what a good SAT score is for your specific circumstances?
What's a Good 2018 SAT Score for You?
In the end, when it comes to figuring out what a good SAT score is, what really matters is finding the score that's good for you. This means calculating what score you'll need to have a good chance of admission to the schools you want to get into. At PrepScholar, we refer to this as your target score.
What you choose as your target score should depend entirely on what schools you're applying to. For example, for a student applying to highly competitive schools like Caltech (1560 average SAT score) or Yale (1540 average SAT score), a good SAT score will be at or just below 1600. But for a student applying to schools like UC Merced, a solid target score might be something closer to 1250.
Where are these specific numbers coming from? Find out in the next section that will take you through calculating your target SAT score, step by step.
Choosing an SAT Score Goal for 2018
Below, we'll walk you through the three vital steps to follow to determine your score goal. You can download a PDF of a blank chart from this ebook, or create one yourself. Here's an example of what your chart might look like:
| School Name | 25th Percentile SAT Score | 75th Percentile SAT Score |
|
|
|
|
|
|
|
|
|
|
|
|
|
|
|
|
Step 1: Fill In Your Schools
The first step is to list the schools you know you want to apply to in the far left column, like this:
| School Name | 25th Percentile SAT Score | 75th Percentile SAT Score |
|
Wellesley College |
|
|
|
Wesleyan College |
|
|
|
Ohio Wesleyan University |
|
|
|
Wells College |
|
|
Note: This is just an example list. We don't recommend picking schools solely based on the fact that their names sound similar.
If you're not sure what schools you'll be applying to yet, you can still list the ones that have been suggested to you by guidance counselors, parents, teachers, and friends. To arrive at the most accurate target score, though, it's better to take the time to research schools and figure out which ones you're interested in, then add them to your list.
 Think about what schools you plan to apply to, then write the names down in your target score chart. Victor van Werkhooven/Flickr.
Step 2: Find SAT Score Information for Your Schools
The next step is to find out the 25th and 75th percentile out-of-1600 SAT scores for your schools. (If you want to figure out what scores you should aim for in Math and Evidence-Based Reading and Writing as well, go to this link to download the charts.)
A quick way to do this is to look for your schools in our PrepScholar college database. Start by searching for "[School Name] prepscholar sat or "[School Name] prepscholar".
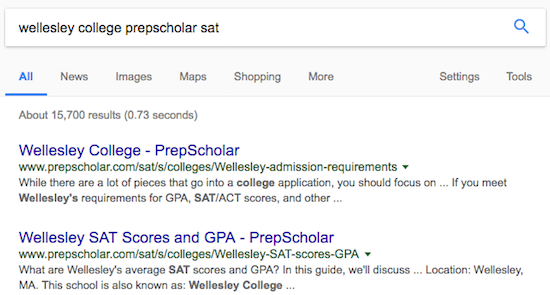
You can then go to either the admissions requirements page or the SAT and GPA page—both have SAT score information. Scan the page for the school's new SAT score information; specifically, you're looking for the 25th and 75th percentile scores. This information is important because it will tell you the SAT scores of the middle 50 percent of admitted applicants for that specific school.
If you can't find your school in our database, you can search each school's website for their most recent admissions information (usually in their Common Data Set or Incoming Class Profile pages). However, because no two college websites are organized the same way, this is a long and arduous task, particularly if you're looking at 10+ schools (which is why we recommend using the PrepScholar database first). You'll also need to make sure the scores on the school pages are for the new SAT and not the out-of-2400 SAT; if they are for the old SAT, you can convert them to the new SAT scale using these conversion charts.
Here's our sample target score chart again, now with SAT score information filled out for each school:
| School Name | 25th Percentile SAT Score | 75th Percentile SAT Score |
|
Wellesley College |
1370 |
1530 |
|
Wesleyan College |
1340 |
1520 |
|
Ohio Wesleyan University |
1090 |
1320 |
|
Wells College |
1020 |
1240 |
Step 3: Calculate Your Target SAT Score
Finally, it's time to calculate your target score. For your best shot at getting into your schools, you'll want this score to be the highest 75th percentile score in your chart (since that will mean you're scoring as well as or better than at least 75% of all admitted students in all the other schools as well). In our sample chart, this score is an extremely high 1530—a 99+ percentile score!
If this target score is so high as to seem completely unobtainable and hopeless, you can aim for a slightly lower score. Ideally, this score will be the second-highest 75th percentile score (in our sample chart, a 1520—not much different), or in between the second-highest and highest 75th percentile scores.
You can also always go with the median of the 75th percentile score column in your chart (in our sample chart, (1520+1320)/2=1420), although this may pull down your chances of getting into the schools with higher 75th percentile scores. Alternatively, you can start out by aiming for this lower score, then upping your goals once you attain it.
Once you have your target total SAT score, you can also calculate your rough target section scores by dividing your total target score by two and rounding up. In our example of a 1530 target total score, this gives us target section scores of 770 for Evidence-Based Reading and Writing and Math. (If you do want to calculate exact target scores for each section, follow the instructions in this article.)


Are Good SAT Scores in 2018 Different From Past Years' Good SAT Scores?
We've now gone through three different criteria that can be used to determine what a good SAT score is: a score higher than the average SAT score, a score higher than 90% of students' scores, or a score higher than scores of 75% of students admitted to the schools you're applying to. But you might still have the lingering question: are good SAT scores in 2018 different from what good SAT scores were in past years?
The short answer to this question: no, there's not really a difference between good SAT scores in 2018 vs. good SAT scores in past years.
The longer answer involves getting back down into the details of SAT score data. Because 2017 was the first year the College Board released information about performance on the new out-of-1600 SAT, any comparison of those scores with past years' SAT scores requires score conversion. In the table below, I've converted the 2017 SAT score averages to the old SAT format for ease of comparison.
Average SAT Scores 2006-2017
| Year | Total | Critical Reading | Writing | Math |
| 2006 | 1518 | 503 | 497 | 518 |
| 2007 | 1508 | 501 | 493 | 514 |
| 2008 | 1507 | 500 | 493 | 514 |
| 2009 | 1505 | 499 | 492 | 514 |
| 2010 | 1506 | 500 | 491 | 515 |
| 2011 | 1500 | 497 | 489 | 514 |
| 2012 | 1498 | 496 | 488 | 514 |
| 2013 | 1498 | 496 | 488 | 514 |
| 2014 | 1497 | 497 | 487 | 513 |
| 2015 | 1490 | 495 | 484 | 511 |
| 2016 | 1484 | 494 | 482 | 508 |
| 2017* | 1450* | 500* | 450* | 500* |
Table data taken from College Board's Total Group Reports 2016 and 2017.
*Data converted from new 1600 SAT format to old SAT format.
At first glance, it might seem like there's been a slight decline in average SAT scores over the last ten years, with a huge drop this past year for Writing in particular. If you go by averages alone, then it's easy to conclude that a good SAT score is lower for 2018 than it was in the past.
However, there are a couple of important factors that you need to take into account when looking at this data. Converting between the old and new SAT is tricky because of how different the tests are, and Writing scores are particularly difficult to compare between the old and new SAT because old SAT Writing scores took your essay score into account, while new SAT Writing scores don't. It's possible that the 30-point Writing score drop in 2017 because the College Board didn't get the conversion quite right when removing the essay.
Furthermore, averages are just one way of tracking changing scores. Another is the distribution of SAT scores. Let's look at how the range of scores changed from 2011- 2016. (I've left out scores on the new SAT scale for clarity's sake.)
SAT Score Percentiles 2011-2016
| Year | # tested | 90th %ile |
75th %ile |
50th %ile |
25th %ile |
10th %ile |
| 2011 | 1,647,123 | 1930- 1940 |
1720 | 1490 | 1280 | 1110 |
| 2012 | 1,664,479 | 1930- 1940 |
1720 | 1490 | 1280 | 1100 |
| 2013 | 1,660,047 | 1930- 1940 |
1720 | 1490 | 1280 | 1100 |
| 2014 | 1,672,395 | 1930- 1940 |
1720 | 1490 | 1270 | 1090- 1100 |
| 2015 | 1,698,521 | 1930- 1940 |
1720 | 1480 | 1260 | 1080- 1090 |
| 2016 | 1,637,589 | 1930- 1940* |
1710- 1720* |
1470- 1480* |
1260- 1270* |
1090- 1100* |
*2016 percentiles are approximate and based on PrepScholar's calculations, as the College Board did not release percentile data that year. Number of test takers for that year is from the College Board.
As with averages, some of the percentile scores (mostly the 10th-50th percentile scores) have gone down a little bit over time. Over the years, as more students took the SAT each year, fewer test takers were reaching certain scores each year, which lowered the percentile scores.
The changes in percentile scores, however, are fairly slight: of the percentile scores that decreased, almost all dropped by only 10 or 20 points, which is not enough of a change to indicate a significant trend.
Interestingly, some of the percentile scores didn't change at all over the same period of time. From 2011 to 2016, the 90th percentile scores remained exactly the same, and the 75th percentile score nearly so, meaning that the same percentage of test takers were scoring at or near these scores each year.
The overall consistency in SAT score percentiles, coupled with the fact that students may take the SAT over multiple calendar years (e.g., fall and spring junior year) suggests that what's a good SAT score hasn't changed much in the last few years.
In Conclusion: What Are Good SAT Scores for 2018?
There are multiple ways to define what is a good SAT score for 2018. The broadest comparison means looking at your SAT score and comparing it to the average SAT score (1060). If you scored at or above the average SAT score, you did well; if you scored below this score, you did not.
A slightly more nuanced view takes into account different score percentiles and lets you compare your score against categories like the top 10% and the bottom 10% of students (1340 and 910 total SAT scores, respectively). If your score is equal to or above 1340, then congratulations—you're part of the top 10% of students who took the SAT! If your score is at or below 910, then you're in the bottom 10% of all students who took the SAT, and will probably need some dedicated studying to bring your SAT score up to your target score.
While averages and percentiles give you an objective way to compare your score to the scores of other students, however, the most helpful way to think about it is to compare your score to the scores of students admitted to colleges you want to attend. To do this, you'll need to pick a target score, and then shape your SAT studying around meeting that goal.
Ultimately, a good SAT score is one that gets you into the colleges you want to go to. If you follow our guidelines for choosing a score goal and work hard to attain it, you'll guarantee yourself a strong chance of being admitted to the schools you want to get into.
 Hitting your target SAT score takes you one more step up the ladder to reach your college admission goals.
What's Next?
Figuring out your target score is just the first step of planning out your test prep schedule. To find out what other steps you need to take, follow our guide to building your very own SAT study plan.
If you haven't scheduled your SAT yet, you'll want to get on that (or at least get an idea of when the test is offered this year). Use our guide to choosing an SAT test date to see what your options are.
Not quite hitting your target score yet? We have two sets of strategies, tailored to students at different skill levels. If you're regularly getting a 600+ on Math and EBRW but aren't quite hitting the score you need, be sure to read our articles on how to get a perfect SAT score and perfect Math, Reading, and Writing scores. If you're aiming for a 1200 total SAT score but aren't there yet, then our articles on how to improve low Math, Reading, and Writing SAT scores will be a better fit.