Studying statistics? Then you've likely heard the phrase "normal distribution" when describing data. But what about the phrase "skewed right"? What does a right-skewed histogram look like? And what causes it?
In this article, we give you examples of histograms skewed to the right and explain how these differ from normal distribution graphs.
Feature image: Monika Wahi/Wikimedia Commons
What Is Normal Distribution?
Before we explain what it means when data is skewed right, let's review the definition of normal distribution.
With normal distribution, two or more variables share a direct relationship to make a symmetrical data set, on which the left half mirrors the right half. These graphs are called bell curves due to their clearly defined, bell-like shape:

On a normal distribution graph, the mean (average), median, and mode are all equal. These points all represent the center of the data, or the peak of the graph.
What Does Skewed Right Mean?
While normal distribution is one of the most common forms of distribution, not all data sets follow this basic curve. In other words, some histograms are skewed to the right or left.
With right-skewed distribution (also known as "positively skewed" distribution), most data falls to the right, or positive side, of the graph's peak. Thus, the histogram skews in such a way that its right side (or "tail") is longer than its left side.

Example of a right-skewed histogram.
On a right-skewed histogram, the mean, median, and mode are all different. In this case, the mode is the highest point of the histogram, whereas the median and mean fall to the right of it (or, visually, the right of the peak). Note that the mean will always be to the right of the median.
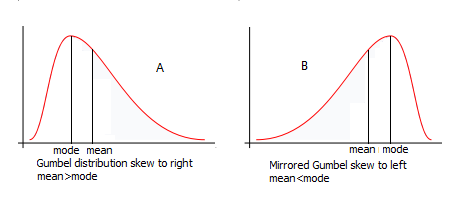
Graph A is skewed right, while Graph B is skewed left. With right-skewed graphs, the mean always comes to the right of the mode (i.e., the peak). (Asitgoes/Wikimedia Commons))
These features ultimately make it difficult to assign a typical value as there is no clear center point on a right-skewed graph. By contrast, with normal distribution, because the mean, median, and mode are all equal and come at the center of the data set, you can easily use this value to more accurately generalize the data.
What Causes a Right-Skewed Histogram?
Data skewed to the right is usually a result of a lower boundary in a data set (whereas data skewed to the left is a result of a higher boundary). So if the data set's lower bounds are extremely low relative to the rest of the data, this will cause the data to skew right.
Another cause of skewness is start-up effects. For example, if a procedure initially has a lot of successes during a long start-up period, this could create a positive skew on the data. (On the opposite hand, a start-up period with several initial failures can negatively skew data.)