

Not sure how to use Microsoft Excel? Then you've come to the right place! Microsoft Excel comes with most Microsoft suites and is a commonly recognized computer application that many of us use at one time or another.
While known primarily as a spreadsheet tool, Excel is constantly introducing new functions and is very useful even for people who only need it for basic tasks. With Excel, you can do things such as balance your household budget, make charts for presentations, and analyze data for businesses.
This Excel guide will take you through how to use Excel, including the basic functions, a few key advanced skills, and Excel tips and tricks everyone should know. I recommend following along in Microsoft Excel as you walk through this guide.
What Is Microsoft Excel?
Excel is an electronic spreadsheet program that's hosted by Microsoft office and used for storing, organizing, and manipulating data. Excel can be used for many basic functions but also offers a variety of more advanced functions.
People across all industries can use Excel and likely have used it at one time or another. This also means that people are always searching for guides on how to use Microsoft Excel, as well as Excel tips and tricks they can use to master the program. Excel is used often by accountants and financial analysts.
The great thing about the program is that you can use its basic functions for something as simple as making lists, or use its more advanced functions for things like making charts and pivot tables.
By learning how to use Excel at any level, you can acquire better time-management skills and find the most useful tools for whatever you need.
What Does Excel Look Like? Layout and Features
Since Excel is a Microsoft program, its layout is similar to that of other Microsoft programs in that the application toolbar includes features such as "File," "Edit," "Tools," etc.
In Excel, columns are organized by letter and rows are organized by number. As the columns go past what’s available in the alphabet, they will be labeled AA, AB, AC, and then BA, BB, BC, CA, CB, CC, and so on. This means that each cell has a name. For example, the cell in column A and row 5 is called A5. This trait makes it easy to find the information you need and to enter formulas.
On this tab, you’ll see some of the Microsoft functions you’re familiar with, such as the font, copy and paste tool, and wrap text option; however, you’ll also see some Excel-specific functions, like highlighting cells. Other tabs include "Layout," "Tables," "Charts," "SmartArt," "Formulas," "Data," and "Review."
It's best to explore these functions so you can get a handle on where to find them; you might not need them all, but you want to have a sense of where to find them and what Excel has to offer.

8 Essential Microsoft Excel Functions to Know
Mastering the basics of Excel is the first step in learning how to use Excel and becoming an Excel pro. Some users can get by on the basics alone, but these skills are ones that everyone who uses the program should have. Once you learn the interface and start using the program, you should know how to use Microsoft Excel effectively in no time.
Below are eight essential Excel functions everyone should know how to use.
Basic Function 1: Creating a Sheet
The first step to any Excel project is to open the application. In the most recent version, you’ll come to a gallery that has options for page layouts and common projects. For most items, and for the most amount of function and flexibility for your projects, you’ll select Excel workbook. This will open a grid-like sheet onto which you can begin to enter your data.
Basic Function 2: Adding Tabs
On the bottom of the sheet, you will see the tabs. The tab you have open is called "Sheet 1" and is automatically created when you open a new workbook. Utilizing tabs is a great way to stay organized in your project; you can separate out the information by category or keep elements of a project separate.
For example, if you’re working on an event, you can keep a list of vendors and contact information on one tab, the budget on another, and a list of when invoices are due on a third.
To create a new tab, click on the plus sign (+) next to the existing Sheet 1 tab. The new tab will appear as Sheet 2. Continue adding tabs as necessary. To rename a tab, you can do one of two things: double-click on the tab, or right-click on the tab (ctrl + click on a Mac) and select "Rename." Type in the new name and then hit enter.
Basic Function 3: Autosum
One of the simplest and most useful features of Excel is autosum. Autosum quickly adds up columns and rows of numbers.
To use autosum, highlight the row or column and leave one additional cell at the end of the row or column. In the row of icons at the very top of the workbook, you’ll see one that looks like a small, blue backwards Z.

Click on it and the sum will appear in the previously empty cell at the end of the row or column.
Basic Function 4: Changing Cell Types
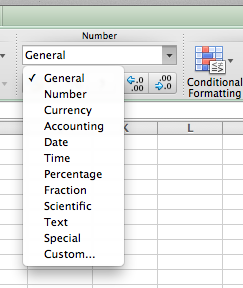
Data can be entered in a variety of ways depending on what you need to do with it. In Excel, there's a series of tabs on the top with labels such as "Home," "Layout," "Tables," etc. On the Home tab, you’ll find a drop-down menu labeled "Number."
In the drop-down menu, you’ll see that there are several options for cell type, such as "General," "Number," "Currency," and "Accounting." The default cell type is "General."
You can change the cell type by right-clicking on the cell and selecting "Format Cell" from the menu. The "Format Cells" box that appears has tabs as well, with labels such as "Number," "Alignment," "Font," "Border," "Fill," and "Protection."
In the Number tab is a column that has the cell types; this is where you can choose the cell type. You can also change many cells at once by highlighting them and selecting your desired cell type from the drop-down menu, or by following the procedure in the "Format Cells" menu.
Basic Function 5: Formatting Cells
There are lots of other formatting options in the "Format Cells" menu discussed above. There’s no correct format, so play around with the formats and see what works best for you and your project.
Here, you can change things such as font and alignment. Adding a border to cells is a common formatting feature since it aids readability, especially if you’re planning to print your spreadsheet. Remember that you can change the format for multiple cells at a time if needed.
Basic Function 6: Sorting Data
Highlight the data you want to sort. You can then sort what you highlighted by going to the Data tab and selecting "Sort." You can sort alphabetically (A-Z), by cell color, or by cell icon; you also have the option to custom sort.
Basic Function 7: Merging Cells
With Excel, you can merge any cells that border one another. Two or more cells can be merged together to create one large cell. Highlight the cells you want to combine as one and then go to the Home tab. In the "Text Alignment" bar, select the option labeled "Merge."
Basic Function 8: Incorporating Formulas
Excel has formulas that allow for quick computing. While there are plenty of formulas to learn, we’ll go over a few basic ones and how to enter them here. Microsoft offers an Excel formula workbook, which is a really handy resource I recommend using.
To enter a formula, select the cell in which you want the result to appear and type the formula in the formula bar above. This the bar labeled fx. All formulas should start with an equal sign (=).
After the equal sign comes the cell name. For example, say you have a complex number or equation in cell E5 and another in cell D5, and you need to subtract what’s in cell D5 from cell E5. You can select any other cell (say, F5) and enter this formula to find the difference: =E5-D5. The answer will then automatically appear in cell F5.
Another useful formula is SUM. We discussed autosum above, but you might have more specific needs.
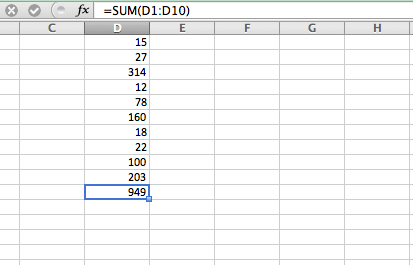
For example, say you have a list of numbers in column D that goes from D1 to D10. In cell D11, you want to see the sum of all the numbers, but you also want to see the sums of just a few of the numbers in that column.
To find the total sum, you can enter the formula =SUM(D1:D10) in D11. The colon indicates that all cells from D1 to D10 should be included.
To add up specific numbers, you can enter the formula =SUM(D1,D5,D7), or whatever cells you specifically want to add, in D11. The commas here indicate that only the cells specifically mentioned should be included.
AVERAGE is another commonly used formula, and it works the same way as SUM. So to average an entire column of numbers, you'd use the formula =AVERAGE(D1:D10). And to average specific cells, you’d enter =AVERAGE(D1,D6,D8).
6 Advanced Excel Tips and Tricks to Learn
As we know, Excel is ultra-powerful and offers a ton of options for organizing and viewing your data. Excel can also help you make sense of your data and present it in different ways, so you can draw conclusions from that data without getting lost in it.
Below are six key advanced functions to help you get started.
Advanced Function 1: Creating Charts
Excel has many different types of charts, as seen in the Charts tab, including pie charts, bars, columns, and line charts.
As an example, say you've created a report that shows quarterly profits for your company, and you've got all your data entered. Your columns are Q1, Q2, Q3, and Q4, while your rows are by division and have the division names. The rest of the cells contain monetary values.
Highlight the data you want to graph and select the chart you want from the menu. Once the chart has been created, by selecting it you will see two new tabs labeled "Chart Layout" and "Format." Use these functions to edit your chart.

Advanced Function 2: Creating Tables
Tables are helpful in sorting and filtering your data. To create a table, highlight the data you want to put in a table and then go to the Table tab. Select the table format and edit the table using the options available.
You’ll see that each column now has an arrow on it. The arrows allow you to sort and filter the information available. For example, if I have a table that contains book titles, authors, prices, and genre, I now have the option to filter and sort any way I want. I could sort by price from lowest to highest and then filter out any books that are not mysteries by un-checking everything except "Mysteries" in the menu.
Advanced Function 3: Merging Sheets
The easiest way to merge two sheets is to copy and paste one into the other, if you want all the data on the other sheet; however, it’s easy to lose data this way and make mistakes. You can consolidate some or all of the data by going to the Data tab and hitting "Consolidate" under the Tools section.
A menu will pop up that will ask you for a reference—this means what data you want to merge on that sheet. Highlight what you want to merge and then click on the icon to expand the menu. Clicking "Add" will put your reference in the "All References" box.
Next, go over to Sheet 2 and select the arrow icon to make the box small again. Highlight the data on Sheet 2 that you want to merge and expand the menu again. Click "Add" to include this in your "All References" box.
Make sure to check the "Top Row" and "Left Column" boxes before you hit "OK." The merged data will appear on a new sheet.
Advanced Function 4: Conditional Formatting
In addition to standard formatting, you can add in formulas that dictate formatting based on characteristics of the cells’ data. This way, as you add and delete cells, they will follow the same format you already have on your sheet.
On the Home tab, select "Conditional Formatting." In this menu, you can add in options for how to represent your data. For example, if you have a list of people’s emails, and want to highlight only those that are from a certain web server, you'd go to Conditional Formatting→ highlight cells rules → text that contains → and add in @emailserver.com.
All cells that contain that text will be highlighted on the sheet. If you add a new email address, it will also appear highlighted.
You can use this with numbers, too, to indicate value in relation to your project. If you’re showing quarterly sales, you could highlight the highest and lowest profits, or use the icon formatting to show the highest and lowest thirds of your total profits.
Advanced Function 5: Making Pivot Tables
A pivot table is one of the most useful advanced functions you'll come across as you learn how to use Excel.
When you have a lot of data in your Excel sheet and you need to summarize and reorganize that data, you'll want to use a pivot table. The power of a pivot table is that all the data stays in it, but you’re able to view only what you need to look at in order to make sense of that data. For example, you might have your profits listed by division but have included data for each quarter this year and for the previous three years.
With a pivot table, you can answer questions such as, "How did we do in Q1 this year compared to Q2 last year?" and more. Pivot tables don’t change your data—they just allow you to continue reorganizing it and making reports for what you need. Make sure your data is well organized, with vertical lists that have titles.
To create a pivot table, highlight the data you want to include and head to the Tables tab. Go to "Format as Table" and select one of the formats. This makes it easier to add and edit information later, and the pivot table retains the changes. Select "Summarize with Pivot Table."
A menu will appear that will ask you what table you’d like to turn into a pivot table (this will most likely be the one you have highlighted, but you should always double-check!) and where you want the pivot table to appear. It’s easier to do it on a new worksheet so you don’t get confused. On a new blank sheet, a panel will appear on the right that says "Pivot Table Fields."
All the titles of your columns on the report will appear by their names. You can then organize this however you want. Drag and drop the names into columns and rows, depending on the data you want to view and how.

Advanced Function 6: VLookup
VLookup is a function that allows you to find information within a table, row, or column. It enables you to search for data within a specific range and returns the result in a designated space.
In order to do a Vlookup, you need to pick an area on your workbook to enter the formula/result and a spot to enter your search criteria. Let’s say you’re looking up a salary for an employee with the ID number 18302. Enter the word "ID" in one cell and "18302" in the cell beside it. Underneath "ID," put the word "Salary" in its own cell. Next to this cell is where you will enter the formula.
Let’s say we have the ID number in cell D2 and the salary/formula in D3. Our table ranges from A1 to C12, and in column 1 are the IDs and in column C are the salaries. In order to do VLookup, you need search criteria, search range, and the column from which you want to return a value. You can input the word "True" for an approximate match or "False" for an exact match. So in the formula cell, we'd enter the following: =VLookup(D2,A1:C12,3,False).
I’ve just searched my table and told it to look for an exact match to the criteria specified in D2 and find where it corresponds to column 3, or column C. The result should appear in the cell in which we wrote the formula, D3.
Keep in mind that the columns are counted only within the table when writing a VLookup formula. So if your table starts in column R and goes to column U, then column R is 1, column S is 2, and so on.
Additional Resources for Learning How to Use Excel
Microsoft has a lot of Excel tutorials and step-by-step guides for most functions, an "ask the expert" chat, and links to forums. You can find the guides by going to the official Microsoft support website and searching for what you need to know.
YouTube is another great resource for Excel guides, since the video tutorials walk you through it step by step using a visual aid. You can search by the task or by general tutorials.
It’s useful to find a channel you like and follow it. There are so many excel tutorials out there, so following one channel is helpful since they're often taught by the same person in a style you know that you like and you can ensure you're not repeating anything you've already learned. Technology for Students and Teachers is one of my personal favorites for Excel tutorials.
A lot of tech forums also post Excel guides, answer questions, and give out helpful Excel tips and tricks. This can be a little bit more difficult to navigate, as they might not be answering your specific question, meaning you'll have to dig around. Excel has been updated over the years so you have to make sure you’re looking at the correct version/year.
Before you start searching for resources and guides, make sure you've familiarized yourself with Excel's interface. This way, you can follow along with tutorials without spending time searching for the functions.
It's also important to ensure that when you search, you search for the actual year of the Excel program you're using. The program's been around awhile and has undergone quite a few changes. Those small differences can be a pain to navigate, so always include the year when searching for help.
Excel is a powerful tool, which is its greatest asset, but it can easily make users feel overwhelmed. You can dive into its limitless capabilities and make pivot tables, charts, and tables all day long.
The beauty of Excel is that it has value for everyone and is one of the best programs out there to organize data. This guide is just the beginning of what Excel and you are capable of doing together, so go forth with your knowledge and keep an eye out for more tutorials and guides!
What's Next?
Did you know you can put Excel on your resume? Check out our guides to writing a resume for grad school and putting extracurriculars on your college application to learn how to do this.
If you're interested in diving deeper into computer science and information technology, don't miss this list of the best information technology schools.
Once you've mastered Excel, read up on time-management skills and strategies to get the most out of your day.


